|

The linear type trait genetic evaluations incorporate a
multi-trait analysis. Multiple trait analysis increases the accuracy of
the evaluations by considering the genetic correlations of the given linear
trait with all other linear traits.
Genetic evaluations for linear type traits are reported by Holstein Association
USA as Standard Transmitting Abilities, or STAs. STAs rank an animal based
on its genetic merit relative to the average cow born in 2020 in standard
units. Since the bulls being actively marketed by AI organizations have
been heavily selected for production and type traits, the AI bull population
has a higher STA average for most linear traits compared to cows born
in 2020.
Linear type traits can help you breed a more profitable herd of Holsteins
through selecting better bulls. Understanding linear type trait STAs can
help you:
1. identify the most important traits
2. set realistic genetic goals for each trait
3. select a better group of mating sires
4. mate each cow to a complimentary bull
5. accumulate genetic gains across generations
Table 2 shows the average STAs of bulls coded ACTIVE or
LIMITED. Classified cows born in 2020 represent the genetic base for these
averages.
 |
|
|
| Trait |
Average STA |
Direction |
|
Trait |
Average STA |
Direction |
| Stature |
0.40 |
Tall |
|
Fore Udder Attachment |
0.71 |
Strong� |
| Strength |
0.02 |
Strong |
|
Rear Udder Height |
0.93 |
High |
| Body Depth |
0.14 |
Deep |
|
Rear Udder Width |
1.08 |
Wide� |
| Dairy Form |
0.79 |
Open |
|
Udder Cleft |
0.23 |
Strong |
| Rump Angle |
0.21 |
Sloped |
|
Udder Depth |
0.43 |
Shallow |
| Rump Width |
0.61 |
Wide� |
|
Front Teat Placement |
0.32 |
Close |
| Rear Legs - Side View |
0.30 |
Straight |
|
Rear Teat Placement |
0.33 |
Close |
| Rear Legs - Rear View |
0.20 |
Straight |
|
Teat Length |
0.18 |
Short |
| Foot Angle |
0.22 |
Steep |
|
Udder Composite |
0.64 |
High |
| Feet & Legs Score |
0.35 |
High |
|
Feet & Legs Composite |
0.23 |
High |
The degree to which a bull or cow is able to genetically influence various characteristics in its offspring is measured by heritability. Faster genetic progress can be achieved for traits which are higher in heritability compared to traits which are lower in heritability. It is difficult to make much genetic progress through selection and mating unless a trait has a heritability of .10 or higher.
Table 3 contains estimates of heritability for linear traits currently summarized by the Holstein Association, USA.
As Table 3 shows, the linear type traits differ substantially
in heritability. For example, udder depth has a significantly higher heritability
than foot angle. As a result, for a given level of selection, we can expect
a greater response in a mating involving udder depth as compared to foot
angle. Both the heritability of the trait and the relative economic relationship
of the trait to overall profitability should be taken into consideration
when determining which traits to incorporate into a breeding program.
Holstein Association USA Linear Composite Indexes combine linear trait information on several related traits into one numerical value. Composite indexes can be used as a selection tool in breeding programs to identify those bulls which are predicted to transmit a desirable combination of the traits in the Composite Index. The traits included in each Composite Index are:
| UDDER COMPOSITE INDEX |
| |
Udder Depth |
Front Teat Placement |
| |
Fore Udder Attachment |
Rear Teat Placement |
| |
Udder Cleft |
Teat Length |
| |
Rear Udder Height |
Stature |
| |
Rear Udder Width |
|
| DAIRY CAPACITY COMPOSITE INDEX |
| |
Dairy Form
|
| |
Strength
|
| FEET & LEGS COMPOSITE INDEX |
| |
Foot Angle |
Feet & Legs Score |
| |
Rear Legs - Side View |
Stature |
| |
Rear Legs - Rear View |
|
| BODY WEIGHT COMPOSITE INDEX |
| |
Stature |
Rump Width |
| |
Body Depth |
Dairy Form |
| |
Strength |
|
| |
|
|
|
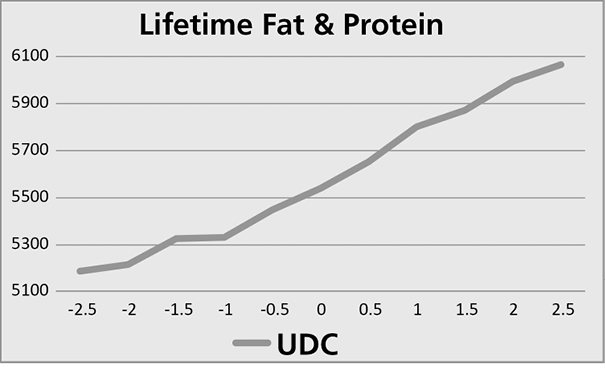
Udder Composite and Feet & Legs Composite were developed to increase individual lactation averages, productive life, and lifetime production of fat and protein. A negative weight on stature results in the decoupling of the composites from stature, allowing breeders to improve udders and feet & legs without making their cows taller.
Udder Composite describes a well formed capacious udder with strong attachment. Using bulls with a high UDC results in a lowering of the somatic cell score and daughters whose udders are trouble-free and capable of holding more milk.
The UDC formula is as follows:
UDC = [(.16 x FU) + (.23 x UH) + (.19 x UW) + (.08 x UC) + (.20 x UD) +
(.04 x TP) + (.05 x RP*) + (.05 x TL*) - (.2 x ST)] x 1.16
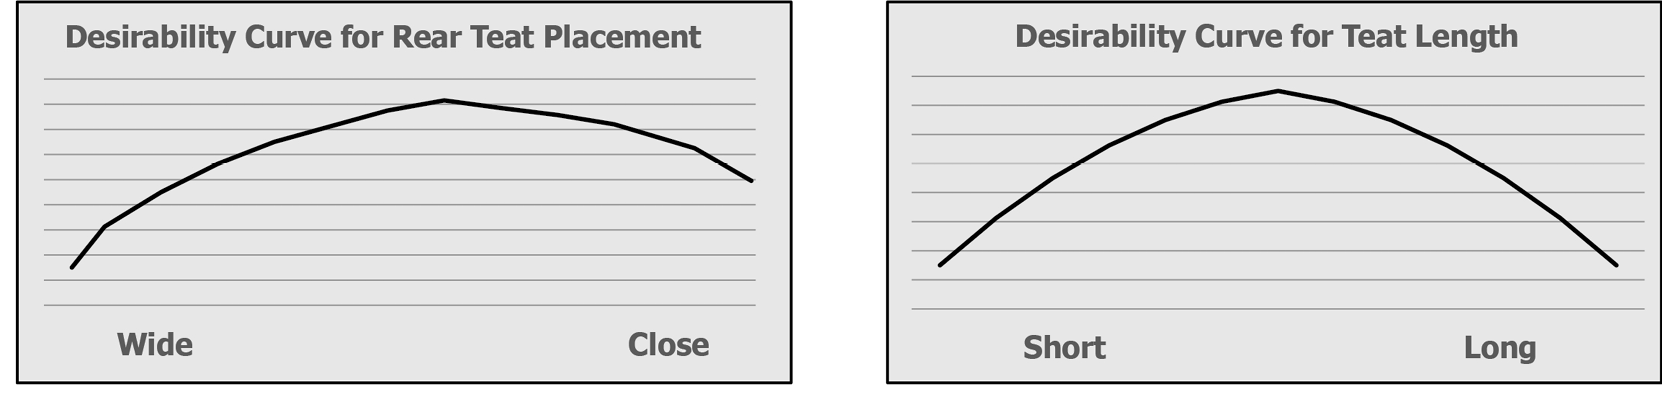
RP* and TL* have an intermediate optimum. There is a penalty for rear teats that are placed too close to one another. The same goes for teat length. Teats that too long or too short are penalized.
The value 1.16 is used to standardize the composite with the 2015 Base Population of cows.
Where:
FU = Fore Udder Attachment
UC = Udder Cleft
RP* = Rear Teat Placement
UH = Rear Udder Height
UD = Udder Depth
TL** = Teat Length
UW = Rear Udder Width
TP = Front Teat Placement
ST = Stature
* If Rear Teat Position is less than or equal to 1, then RP* = RP.
If Rear Teat Position is greater 1, then RP* = 1-(RP x 0.1).
**TL* = (-1 x ABS(TL)) - (ABS(TL) x ABS(TL) x 0.1) where ABS(TL) is the absolute value of Teat Length
The desirability curves for Rear Teat Placement and Teat Length are shown below:
The Feet & Legs Composite formula utilizes a combination of the major category Feet & Legs Score along with three linear traits. The FLC formula is as follows:
FLC = [(.05 x FA) + (.20 x RV) + (.05 x SV*)+ (.70 x FLS) - (.20 x ST)] x 1.14
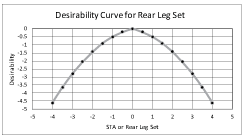
*Where SV (Rear Legs - Side View) has an intermediate optimum
The value 1.14 is used to standardize the composite with the 2015 Base Population of cows.
Where:
FA = Foot Angle RV = Rear Legs Rear View FLS = Feet & Legs Score ST = Stature SV* = Rear Legs Side View
SV* = (-0.27 x ABS(SV)) - (ABS(SV) x ABS(SV) x 0.22)
where ABS(SV) is the absolute value of Rear Legs - Side View
 Feet and legs are a primary concern for dairy producers worldwide. Selecting animals that transmit superior mobility, steeper foot angle, wider rear leg stance with little or no hock-in and slightly straight rear legs (side view) will result in animals capable of longer productive lives. The Feet and Legs Composite was designed to maximize within-herd lifetime production of combined Fat and Protein. Feet and legs are a primary concern for dairy producers worldwide. Selecting animals that transmit superior mobility, steeper foot angle, wider rear leg stance with little or no hock-in and slightly straight rear legs (side view) will result in animals capable of longer productive lives. The Feet and Legs Composite was designed to maximize within-herd lifetime production of combined Fat and Protein.
The Body Weight Composite includes a measure of both body size, i.e., the dimensions of the cow, and dairy form. By including dairy form, we take into consideration how hard the cow is milking, accounting for an excess or lack of body fat. The BWC formula is as follows:
BWC = (.23 x Stature) + (.72 x Strength) + (.08 x Body Depth) + (.17 X Rump Width) - (.47 x Dairy Form)
Every 1.0 STA increase in body size correlates with a 35 pound predicted increase in mature body weight. For example, daughters of bulls that sire large cows (large positive evaluations for body size, +3.00) are predicted to weigh 240 pounds more than those that sire small cows (large negative evaluations for body size, -3.00.)
|


 Udder Composite Index